Prerequisites: ch095 (Midpoints), ch093 (Cartesian Coordinates)
Outcomes: Define slope as rate of change; Interpret positive/negative/zero/undefined slopes; Compute slope from two points
Slope: Rate of Change
The slope of a line measures how steeply it rises or falls.
slope = m = Δy / Δx = (y₂ - y₁) / (x₂ - x₁)
Interpretations:
m > 0: line rises left to right
m < 0: line falls left to right
m = 0: horizontal line (no change in y)
m undefined (Δx = 0): vertical line
Slope as derivative: The slope of f(x) = mx + b at any x is m — the derivative f’(x). For non-linear functions, the slope changes at every point. (Derivatives formalized in ch206 — Derivative Concept.)
In ML, the gradient of the loss function is the multi-dimensional generalization of slope. A slope of -0.3 means “for every unit increase in x, loss decreases by 0.3.”
##

# --- Slope visualization ---
import numpy as np
import matplotlib.pyplot as plt
plt.style.use('seaborn-v0_8-whitegrid')

fig, axes = plt.subplots(1, 3, figsize=(14, 4))
x = np.linspace(-3, 3, 100)

slopes = [(2.0, 'steelblue', 'm=2 (rising)'),
          (-1.0, 'crimson', 'm=-1 (falling)'),
          (0.0, 'darkgreen', 'm=0 (flat)')]

for ax, (m, color, label) in zip(axes, slopes):
    y = m * x + 1
    ax.plot(x, y, color=color, linewidth=2.5, label=label)
    if m != 0:
        # Draw slope triangle
        x1, x2 = 0.5, 1.5
        ax.plot([x1, x2], [m*x1+1, m*x1+1], 'k-', linewidth=1, alpha=0.5)
        ax.plot([x2, x2], [m*x1+1, m*x2+1], 'k-', linewidth=1, alpha=0.5)
        ax.text((x1+x2)/2, m*x1+1-0.3, 'Δx=1', ha='center', fontsize=8)
        ax.text(x2+0.1, m*(x1+x2)/2+1, f'Δy={m:.0f}', fontsize=8)
    ax.axhline(0, color='black', linewidth=0.4)
    ax.set_title(label); ax.set_xlim(-3,3); ax.set_ylim(-4,4)
    ax.set_xlabel('x'); ax.set_ylabel('y')

plt.suptitle('Slope: Δy/Δx', fontsize=12, fontweight='bold')
plt.tight_layout(); plt.show()

# Slope from two points
def slope(p1, p2):
    dx = p2[0] - p1[0]
    if abs(dx) < 1e-12: return float('inf')
    return (p2[1] - p1[1]) / dx

print("slope((0,0),(3,6)):", slope((0,0),(3,6)))   # 2
print("slope((1,3),(4,0)):", slope((1,3),(4,0)))   # -1
print("slope((2,1),(2,5)):", slope((2,1),(2,5)))   # undefined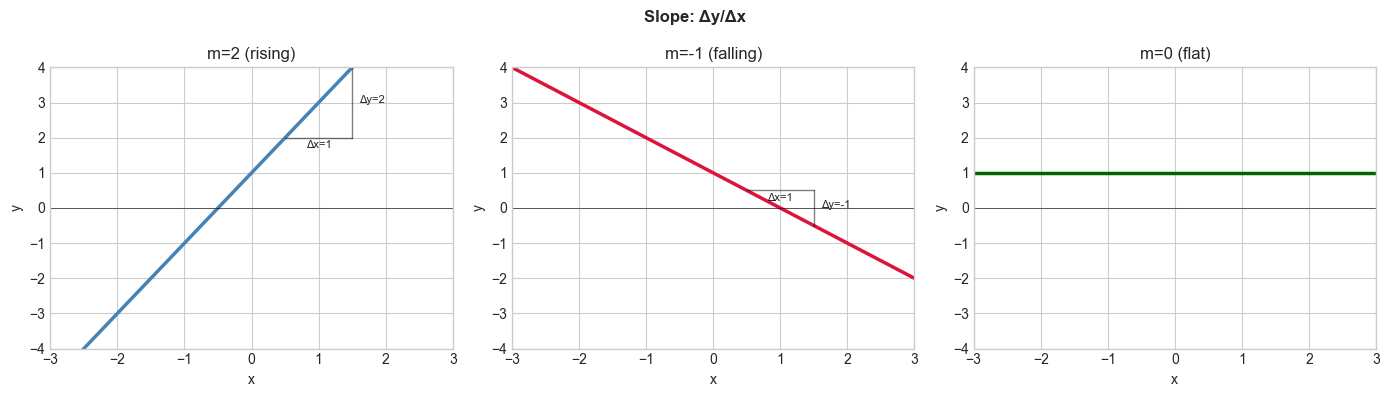
slope((0,0),(3,6)): 2.0
slope((1,3),(4,0)): -1.0
slope((2,1),(2,5)): inf
Summary
slope m = Δy/Δx: how much y changes per unit change in x
Positive: rising; negative: falling; zero: flat; undefined: vertical
Slope is the discrete version of the derivative
In ML: gradient = slope of loss surface; negative slope → decrease parameters to reduce loss
Forward: ch097 converts slope to line equations; ch206 generalizes slope to derivatives.