Chapters 271–300
What This Part Covers
Parts I–VIII gave you the mathematical infrastructure: logic, numbers, functions, geometry, vectors, linear algebra, calculus, and probability. Every one of those tools was built for a reason. Part IX is where you find out what that reason is.
Statistics and data science are the disciplines that connect mathematics to reality — specifically, to reality that is noisy, incomplete, and uncertain. You will learn how to:
Describe and summarize data rigorously
Reason about populations from samples
Test hypotheses and quantify uncertainty
Build, evaluate, and critique predictive models
Understand the information content of data
Implement core ML algorithms from mathematical first principles
Scale computations to data that does not fit in memory
The final chapter (300) assembles everything into a complete, working end-to-end AI system.
The Mental Shift
In Parts VII and VIII, the world was clean. Probability distributions were exact. Integrals converged. Derivatives existed.
In Part IX, the world is not clean. You have a CSV with missing values, duplicates, and inconsistent units. You have 10,000 samples from a process you cannot fully observe. You have a model that performs perfectly on training data and fails in production.
The shift: stop asking “what is the true answer?” and start asking “what is the best answer I can infer, and how confident should I be?”
This requires combining:
Probability (Part VIII) — to model uncertainty formally
Linear algebra (Part VI) — to represent and transform data efficiently
Calculus (Part VII) — to optimize model parameters
Functions (Part III) — to express hypotheses about relationships
Statistics is not a separate discipline from what came before. It is what all those tools look like when applied to real data.
Map of Part IX
Data & Measurement (271)
        │
        ▼
Data Cleaning (272) ──────────────────────────────────────┐
        │                                                  │
        ▼                                                  ▼
Descriptive Statistics (273)                    Feature Engineering (291)
Visualization (274)                             Dimensionality Reduction (292)
Sampling (275)                                          │
        │                                               ▼
        ▼                                     Clustering (293)
Bias & Variance (276)                         Classification (294)
Hypothesis Testing (277)                               │
p-values (278)                                         ▼
Confidence Intervals (279)                   Neural Network Math Review (295)
Correlation (280)                            Optimization Methods (296)
        │                                    Large Scale Data (297)
        ▼                                             │
Regression (281)                                      ▼
Model Evaluation (282)                     Project: Full Pipeline (298)
Overfitting (283)                          Project: Mini ML Library (299)
Cross Validation (284)                              │
A/B Testing (285)                                   ▼
        │                              CAPSTONE: End-to-End AI (300)
        ▼
Bayesian Statistics (286)
Information Theory (287)
Entropy (288)
KL Divergence (289)
Mutual Information (290)
Prerequisites from Prior Parts
| Concept | Where it appears in Part IX | Introduced |
|---|---|---|
| Probability distributions | ch277–279, ch286 | Part VIII |
| Expected value & variance | ch273, ch276 | ch249–ch250 |
| Bayes’ theorem | ch286 | ch246 |
| Dot product, matrix multiply | ch280–281, ch292, ch294 | Parts V–VI |
| Gradient descent | ch281, ch295, ch296 | ch213 |
| SVD / PCA | ch292 | ch173–174 |
| Logarithms | ch287–290 | ch043 |
| Monte Carlo integration | ch285 | ch224 |
| Eigenvalues | ch292, ch295 | ch172 |
If any row in that table feels vague, return to the cited chapter before proceeding.
Libraries Used in Part IX
Per the project rules: implement from scratch first, validate with the library second.
| Library | Purpose |
|---|---|
numpy | Numerical arrays throughout |
matplotlib | Visualization |
pandas | Data loading and cleaning |
scipy.stats | Validation of statistical tests |
sklearn | Validation of ML models |
Every core algorithm in chapters 271–299 is implemented in NumPy first. The library call appears only to verify correctness.
Motivating Problem: You Cannot Solve This Yet
The following cell generates a synthetic dataset and asks three questions. By the end of Part IX, you will be able to answer all three rigorously and implement the answers from scratch.
import numpy as np
import matplotlib.pyplot as plt

rng = np.random.default_rng(42)

# Dataset: 500 users, each with features and a label
n = 500
age          = rng.normal(35, 10, n).clip(18, 70)
session_time = 2.0 + 0.08 * age + rng.normal(0, 3, n)  # correlated with age
pages_viewed = rng.poisson(lam=4, size=n)
purchased    = ((0.3 * session_time + 0.1 * pages_viewed
                 - 0.02 * age + rng.normal(0, 1, n)) > 1.5).astype(int)

# Inject 30 missing values and 5 outliers
missing_idx = rng.choice(n, 30, replace=False)
session_time[missing_idx[:15]] = np.nan
pages_viewed = pages_viewed.astype(float)
pages_viewed[missing_idx[15:]] = np.nan
session_time[rng.choice(n, 5, replace=False)] = rng.uniform(50, 100, 5)

print(f"Dataset: {n} samples, {purchased.sum()} purchases ({purchased.mean():.1%} conversion)")
print(f"Missing session_time: {np.isnan(session_time).sum()}")
print(f"Missing pages_viewed: {np.isnan(pages_viewed).sum()}")
print()
print("Three questions you cannot yet answer rigorously:")
print()
print("Q1: Is session_time a statistically significant predictor of purchase?")
print("    (ch277–280: hypothesis testing, correlation)")
print()
print("Q2: Build a classifier. What is its true out-of-sample accuracy?")
print("    (ch281–284: regression, model evaluation, cross-validation)")
print()
print("Q3: Which feature carries the most information about the purchase label?")
print("    (ch287–290: information theory, mutual information)")
Dataset: 500 samples, 184 purchases (36.8% conversion)
Missing session_time: 15
Missing pages_viewed: 15
Three questions you cannot yet answer rigorously:
Q1: Is session_time a statistically significant predictor of purchase?
(ch277–280: hypothesis testing, correlation)
Q2: Build a classifier. What is its true out-of-sample accuracy?
(ch281–284: regression, model evaluation, cross-validation)
Q3: Which feature carries the most information about the purchase label?
(ch287–290: information theory, mutual information)
fig, axes = plt.subplots(1, 3, figsize=(14, 4))

for ax, (feat, label) in zip(axes, [
    (session_time, 'Session Time (min)'),
    (pages_viewed,  'Pages Viewed'),
    (age,           'Age'),
]):
    valid = ~np.isnan(feat)
    for val, color, lbl in [(0, '#4C72B0', 'No purchase'), (1, '#DD8452', 'Purchased')]:
        mask = valid & (purchased == val)
        ax.hist(feat[mask], bins=25, alpha=0.6, color=color, label=lbl, density=True)
    ax.set_xlabel(label)
    ax.set_ylabel('Density')
    ax.legend(fontsize=8)

fig.suptitle('Part IX Motivating Dataset — Can you predict purchase?', fontsize=13)
plt.tight_layout()
plt.show()

print("These distributions overlap. The signal is real but not obvious.")
print("Part IX gives you the tools to extract it rigorously.")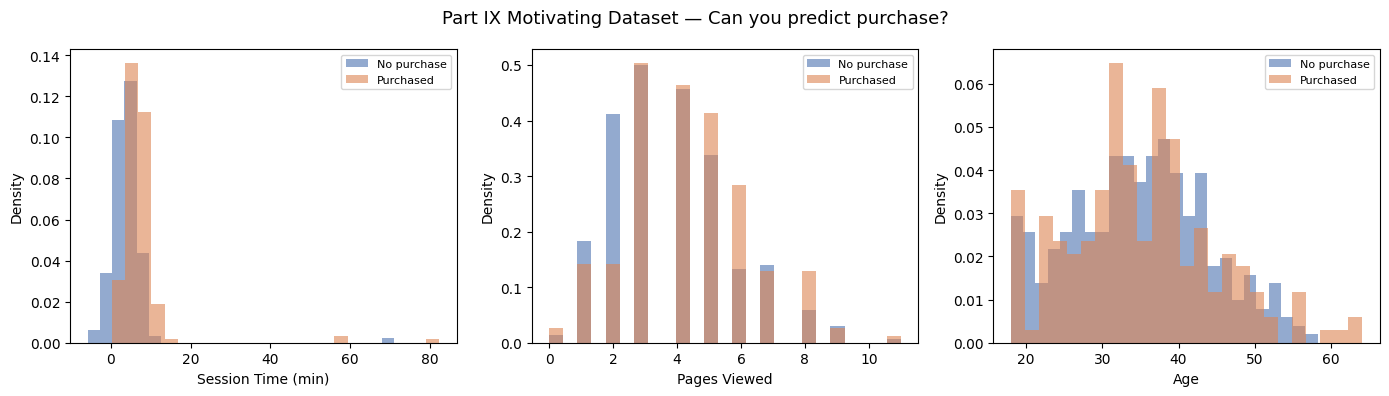
These distributions overlap. The signal is real but not obvious.
Part IX gives you the tools to extract it rigorously.
A Note on Rigor
Statistics is a field where sloppy thinking causes measurable real-world harm: bad drugs get approved, bad policies get enacted, bad models get deployed. The chapters ahead are not a survey. They are a systematic construction of the tools you need to think clearly under uncertainty.
Every formula has a derivation. Every algorithm has an implementation. Every claim can be verified computationally.
Proceed to ch271 — Data and Measurement.