Prerequisites: ch091 (Geometry in Programming)
Outcomes: Define points formally; Understand coordinate systems as choices of reference; Convert between coordinate systems
What Is a Point?
A point is a location in space — it has no size, no direction, just position.
In 2D, a point P is specified by two numbers: P = (x, y). These are its coordinates relative to a chosen coordinate system.
A coordinate system requires:
An origin — the reference point (0, 0)
Two axes — perpendicular directions (x-axis horizontal, y-axis vertical by convention)
A unit — the scale (1 unit = 1 pixel? 1 meter? 1 parsec?)
The choice of coordinate system is arbitrary — it’s a human convenience. The geometry is real; the coordinates are labels.
Key insight: The distance between two points does not change when you change coordinate systems. Only the numerical representation of their coordinates changes. This invariance is fundamental.
Coordinate Systems in Practice
In programming, you encounter multiple coordinate systems:
| System | Origin | y-axis direction |
|---|---|---|
| Math | bottom-left | up |
| Screen pixels | top-left | down |
| OpenGL | center | up |
| GPS | Earth center | complex (lat/lon/alt) |
This matters: if you draw math plots directly to screen coordinates, y is flipped.
matplotlib handles this for you. When writing graphics code from scratch, you must transform.
# --- Coordinate systems demonstration ---
import numpy as np
import matplotlib.pyplot as plt
plt.style.use('seaborn-v0_8-whitegrid')

fig, axes = plt.subplots(1, 2, figsize=(12, 5))

# Math coordinates (y up)
ax = axes[0]
points = np.array([[1,1],[3,2],[2,4],[4,3]])
ax.scatter(points[:,0], points[:,1], s=80, color='steelblue', zorder=5)
for i, (x,y) in enumerate(points):
    ax.annotate(f'P{i}({x},{y})', (x,y), textcoords='offset points', xytext=(5,5), fontsize=9)
ax.axhline(0, color='black', linewidth=1); ax.axvline(0, color='black', linewidth=1)
ax.set_xlabel('x →'); ax.set_ylabel('y ↑')
ax.set_title('Math Coordinates (y up)'); ax.set_xlim(-0.5, 5); ax.set_ylim(-0.5, 5)

# Screen coordinates (y down) - simulate
ax = axes[1]
H = 5  # screen height
screen_pts = points.copy(); screen_pts[:,1] = H - points[:,1]
ax.scatter(screen_pts[:,0], screen_pts[:,1], s=80, color='crimson', zorder=5)
for i, (x,y) in enumerate(screen_pts):
    ax.annotate(f'P{i}({x},{H-int(y)})', (x,y), textcoords='offset points', xytext=(5,5), fontsize=9)
ax.set_xlabel('x →'); ax.set_ylabel('y ↓ (screen)')
ax.set_title('Screen Coordinates (y down, origin top-left)')
ax.invert_yaxis()
ax.set_xlim(-0.5, 5); ax.set_ylim(5.5, -0.5)

plt.suptitle('Coordinate Systems: Same Points, Different Representations', fontsize=12, fontweight='bold')
plt.tight_layout(); plt.show()

# Transform: screen → math
def screen_to_math(p_screen, height):
    return np.array([p_screen[0], height - p_screen[1]])

print("Screen (3, 1) → Math:", screen_to_math(np.array([3, 1]), 5))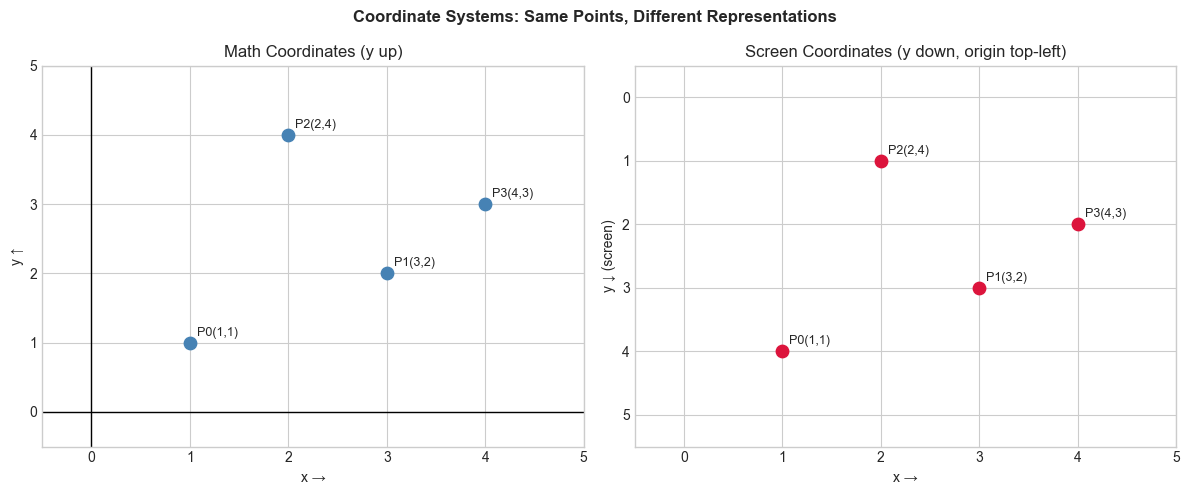
Screen (3, 1) → Math: [3 4]
Summary
A point = (x, y): coordinates relative to a chosen origin and axes
Different coordinate systems: math (y up) vs screen (y down) vs polar vs geographic
Distance and shape are invariant; coordinates change with the system
Always know which system you’re in — coordinate bugs are subtle and common
Forward: ch093 deepens Cartesian coordinates; ch106 introduces polar coordinates. ML connection: ch292 (Feature Engineering) uses coordinate transforms to improve model performance.